|

NonStop
RPM
This is a technical portal for the HPE NonStop Real-time Process Monitor product (RPM).
NonStop RPM is a real-time process monitor that displays instantaneous color-encoded busy alerts for busy processes by Cpu, Node,
super-cluster, and many other ByItems.
RPM Feature Summary:
-
Engineered for HPE NonStop servers.
-
Very efficient low-overhead algorithm
-
Concurrently monitors 1000s of CPUs and millions of processes.
-
Alerts when any CPU or process uses excessive resources.
-
Requires neither MEASURE nor SUPER security group access.
-
Discovers busiest processes in Cpus, nodes, across entire super-cluster,
or across all nodes in Expand networks.
-
Continuous display of busy processes.
-
Can run directly from Tacl/Osh prompt.
-
Instantaneous startup and display.
-
Run line options allow wide range of interfaces and
configurations.
-
Fully configurable sample intervals.
-
Fast sample times down to 1 second.
-
ByCpu displays busiest processes
grouped by Cpu.
-
ByNode displays busiest processes
grouped by node/segment.
-
Super-cluster support allows analysis of busiest processes across very
large collection of NonStop nodes/segments.
-
Reports can be on entire cluster of Cpus/Nodes, or focus on a single
Cpu.
-
Options to graph, select, sort, filter,
and color-code statistics in real-time.
-
Supports many interfaces
including:
ANSI, VT100, T6530, TTY, fat, thin.
-
Monitors, analyzes, and displays both
OSS and NSK process path/filenames.
-
Critical, Warning, Info alert thresholds can be controlled by you to
highlight busiest resources. For Example:
Red
- implies critical > 50% busy
Yellow
- implies warning > 30% busy
Cyan
- implies info > 10% busy
Questions/comments - support
Lastmod: June 4, 2019 |
RPM 1.5 New Graph Reports provide dozens of new reports, and
more...

-
Graphs with color-coded thresholds are now available with all reports. -
Graphs can be either On or Off by default for back/forward compatibility. -
RPM Wizard guides you through new options. Below are a few
Examples: -
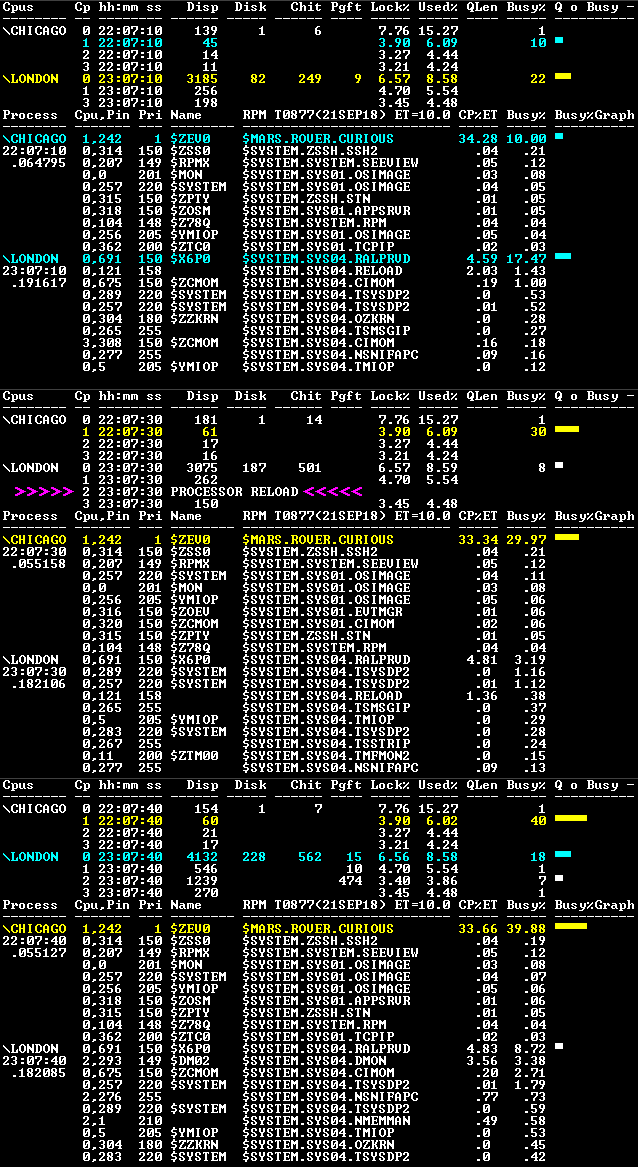
Zoom \* - graphs Cpus,
Ipus, Processes with any option below... Zoom example above. -
Cpu Graph - graphs CPU statistics -
Cpu IPU - graphs CPU and IPU statistics -
Cpu ETA - graphs short+long term
Elapsed Time Analysis (ETA) -
Process - graphs process
statistics -
Process IPU - graphs process IPU
statistics -
Process ETA - graphs short+long term
Elapsed Time Analysis (ETA) -
Process ByItem - graphs any ByItem,
some examples follow... -
Process ByCpu - graphs processes
grouped by Cpus -
Process ByNode - graphs processes
grouped by Nodes -
Process ByMemory - graphs processes
using the most memory -
Process ByInputs - graphs processes with
the most inputs -
Process ByIOs - graphs processes with
the most inputs+outputs -
Process ByOutput - graphs processes with
the most outputs -
Process ByPFS - graphs processes with
most opens in process file space -
Process ByQueue - graphs processes with
the longest receive queue -
Process BySwaps - graphs processes with
the most page faults
RPM 1.4 New Automatic update, Mixed IPUs, Continuous Operation, and
more...

-
Automatic update on Processor in/out of service. Cpu 2 Reload
example above. -
IPU statistics supported on systems with mixed IPU counts. -
Continuous Operation licenses for production environments.
RPM 1.3 New CPU, IPU, Process Reports, and
more...

-
Zoom IPU option provides real time display of CPU, IPU, & Processes
in one color-coded display. Cpu 2 busy IPU example above. -
Monitor feature allows selection of processes to monitor; especially
useful for developers, analysts, operations personnel. -
Reporter feature interviews you to determine what you want to do,
then runs RPM, saves reports to disk. -
New short/long term reports on CPU, IPU, Affinity, Priority, Queue, ...
RPM 1.2 New ByItem Reports provide dozens of new reports, and more...

-
By Item feature allows continuous discovery of busy processes by
selected ByItem... -
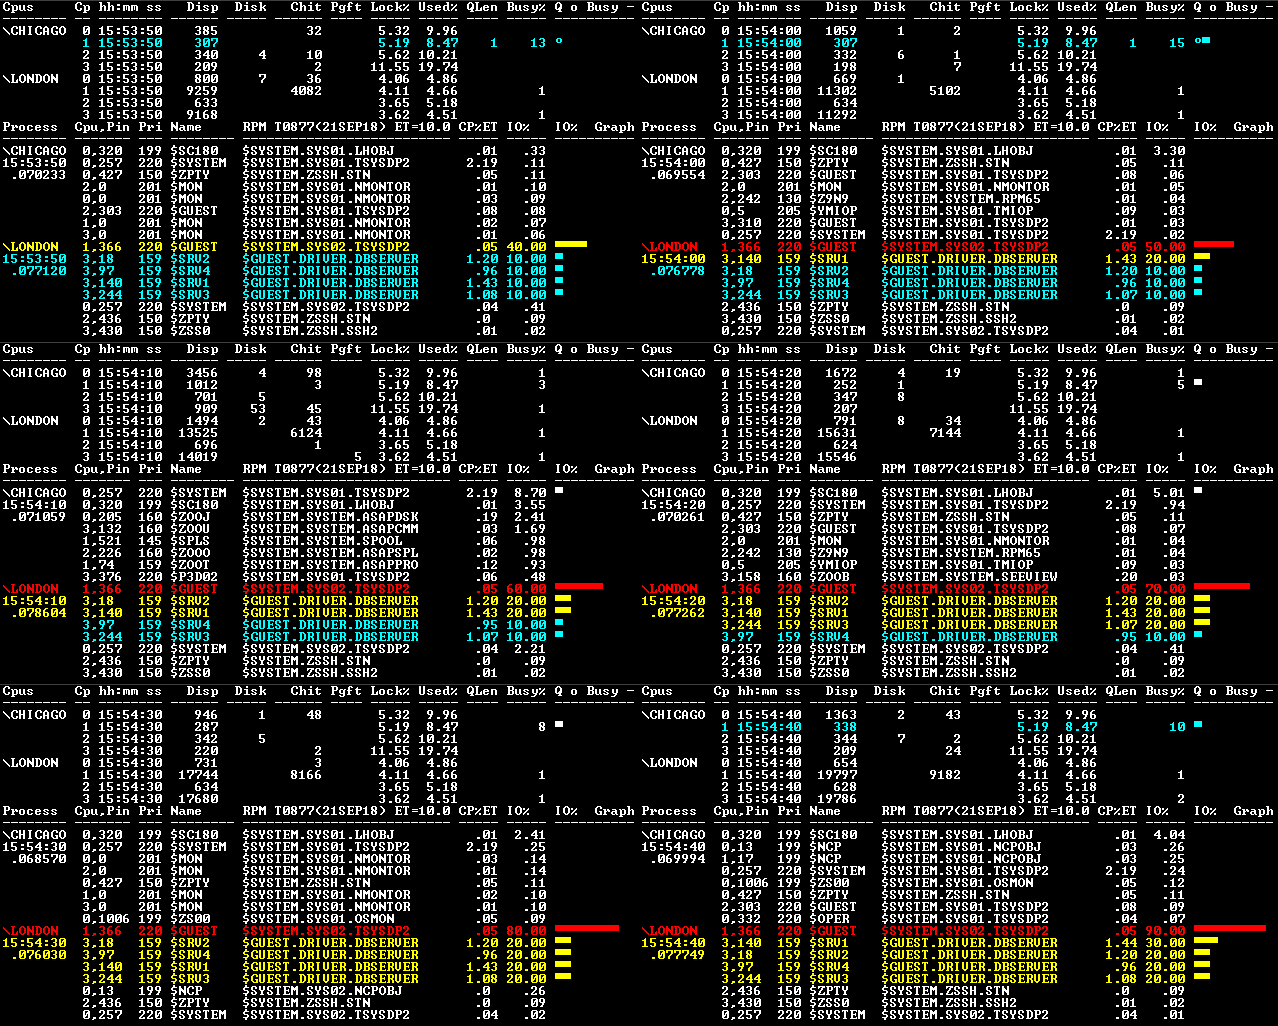
ByIOs finds processes sending+receiving the most messages,
see $GUEST above.
-
ByBusy finds processes using the most processor cycles, see
Figure 1.
-
ByInputs finds processes receiving most input messages, see Figure 2.
-
ByOutputs finds processes sending the most output messages.
-
ByMemory finds processes using the most memory, see Figure 3.
-
ByPFS finds highest users of Process File Segment (PFS), see Figure 4.
-
ByQ finds processes with longest receive queue, see Figure 5.
-
BySwaps finds processes with page faults, see Figure 6.
-
SET MAX options allow color threshold normalization values for rate/second statistics. -
New History command allows you to recall, fix, and re-execute previously entered commands. -
New Elapsed Time display options: ET, ETALL, ETPCT, and DATE allow display and analysis
of short and long term performance metrics side-by-side.
-
Processor and Message overhead reduced by using RPM to tune and analyze itself.
CPU overhead reduced 10-20x.
Msg overhead reduced 1000x.
|


