NonStop RPM Home

Home Examples FAQs Documents Download History Support


NonStop
RPM 
This is a technical portal for the HPE NonStop Real-time Process Monitor product (RPM).

NonStop RPM is a real-time process monitor that displays instantaneous color-encoded busy alerts for busy processes by Cpu, Node, super-cluster, and many other ByItems.

RPM Feature Summary:

  • Engineered for HPE NonStop servers.

  • Very efficient low-overhead algorithm

  • Concurrently monitors 1000s of CPUs and millions of processes.

  • Alerts when any CPU or process uses excessive resources.

  • Requires neither MEASURE nor SUPER security group access.

  • Discovers busiest processes in Cpus, nodes, across entire super-cluster, or across all nodes in Expand networks.

  • Continuous display of busy processes.

  • Can run directly from Tacl/Osh prompt.

  • Instantaneous startup and display.

  • Run line options allow wide range of interfaces and configurations.

  • Fully configurable sample intervals.

  • Fast sample times down to 1 second.

  • ByCpu displays busiest processes
    grouped by Cpu.

  • ByNode displays busiest processes
    grouped by node/segment.

  • Super-cluster support allows analysis of busiest processes across very large collection of NonStop nodes/segments.

  • Reports can be on entire cluster of Cpus/Nodes, or focus on a single Cpu.

  • Options to graph, select, sort, filter, and color-code statistics in real-time.

  • Supports many interfaces including:
    ANSI, VT100, T6530, TTY, fat, thin.

  • Monitors, analyzes, and displays both
    OSS and NSK process path/filenames.

  • Critical, Warning, Info alert thresholds can be controlled by you to highlight busiest resources.  For Example:
     
     Red       - implies critical > 50% busy

     Yellow  - implies warning > 30% busy

     Cyan     - implies info > 10% busy


Questions/comments - support
Lastmod: June 4, 2019

RPM 1.5 New Graph Reports provide dozens of new reports, and more...
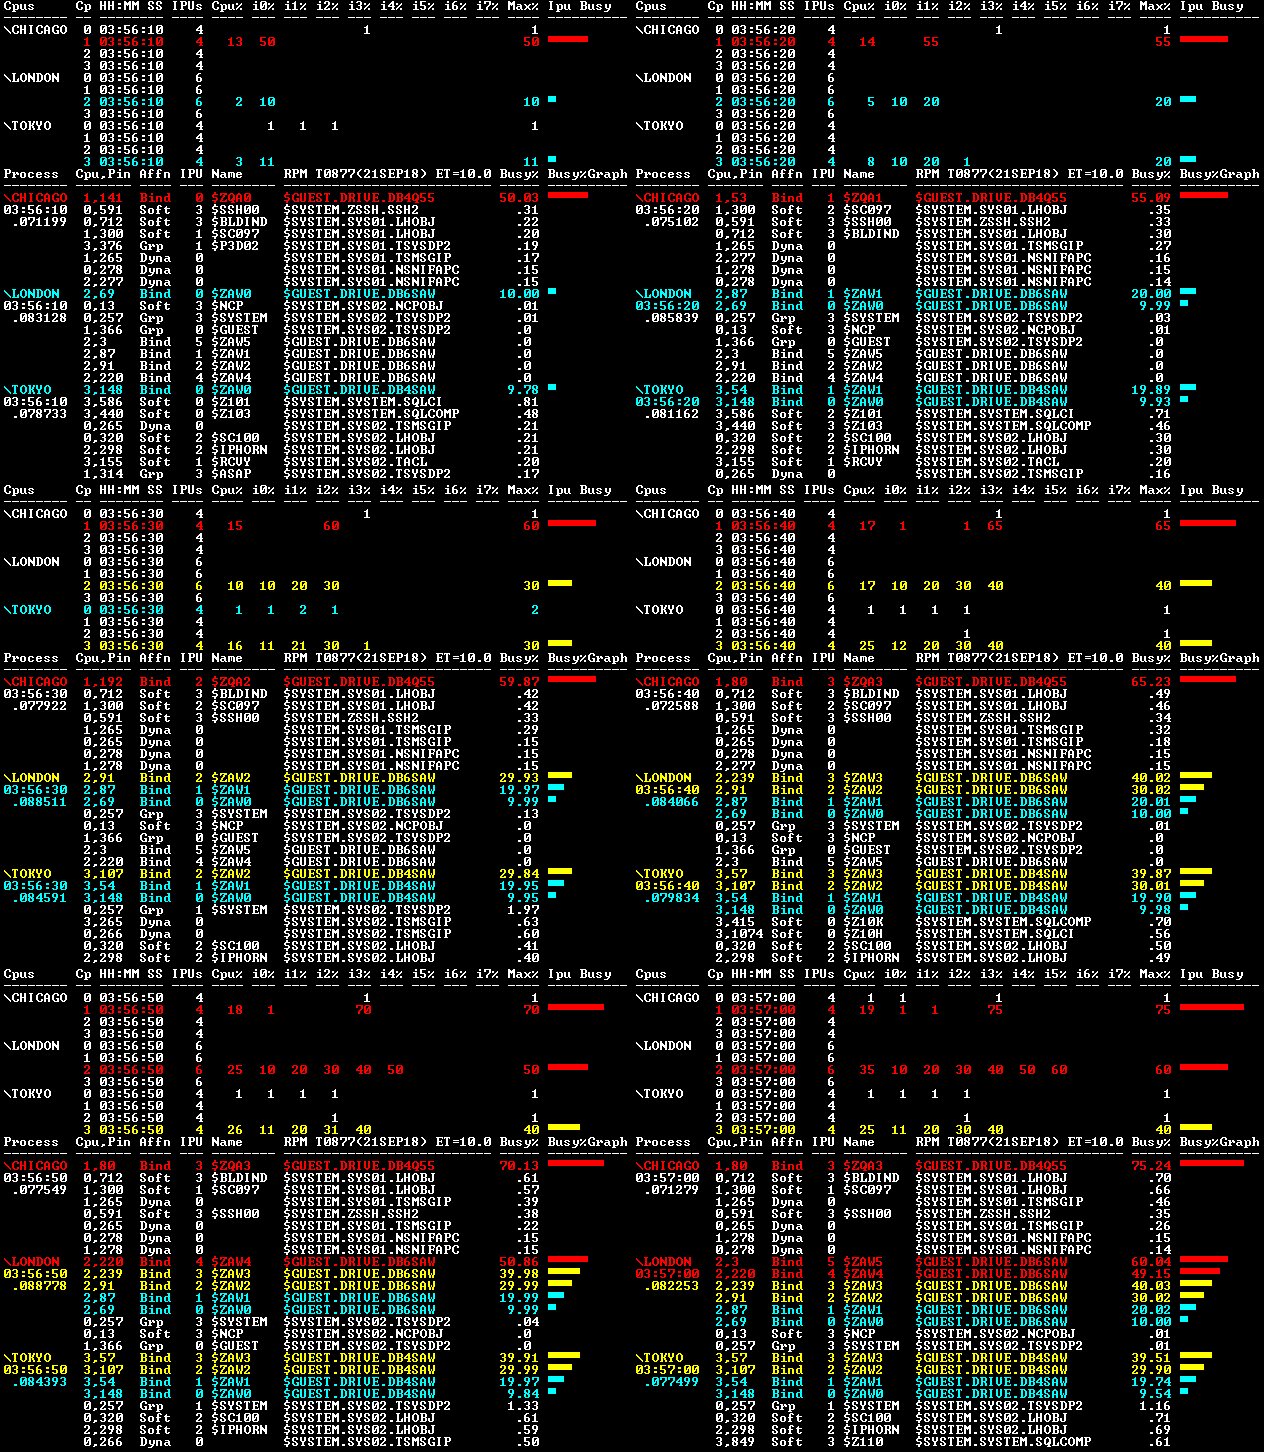
  • Graphs with color-coded thresholds are now available with all reports.

  • Graphs can be either On or Off by default for back/forward compatibility.

  • RPM Wizard guides you through new options. Below are a few Examples:

  • Zoom \* - graphs Cpus, Ipus, Processes with any option below... Zoom example above.

  • Cpu Graph - graphs CPU statistics

  • Cpu IPU - graphs CPU and IPU statistics

  • Cpu ETA - graphs short+long term Elapsed Time Analysis (ETA)

  • Process - graphs process statistics

  • Process IPU - graphs process IPU statistics

  • Process ETA - graphs short+long term Elapsed Time Analysis (ETA)

  • Process ByItem - graphs any ByItem, some examples follow...

  • Process ByCpu - graphs processes grouped by Cpus

  • Process ByNode - graphs processes grouped by Nodes

  • Process ByMemory - graphs processes using the most memory

  • Process ByInputs - graphs processes with the most inputs

  • Process ByIOs - graphs processes with the most inputs+outputs

  • Process ByOutput - graphs processes with the most outputs

  • Process ByPFS - graphs processes with most opens in process file space

  • Process ByQueue - graphs processes with the longest receive queue

  • Process BySwaps - graphs processes with the most page faults

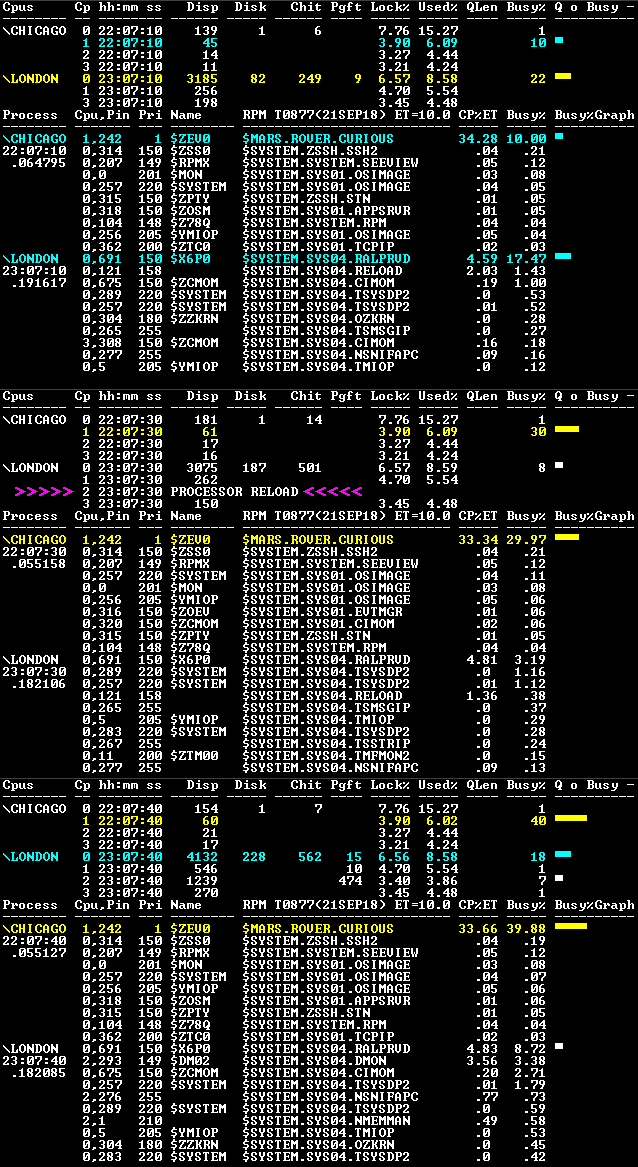
RPM 1.4 New Automatic update, Mixed IPUs, Continuous Operation, and more...
RPM 1.3 New CPU, IPU, Process Reports, and more...

RPM 1.2 New ByItem Reports provide dozens of new reports, and more...
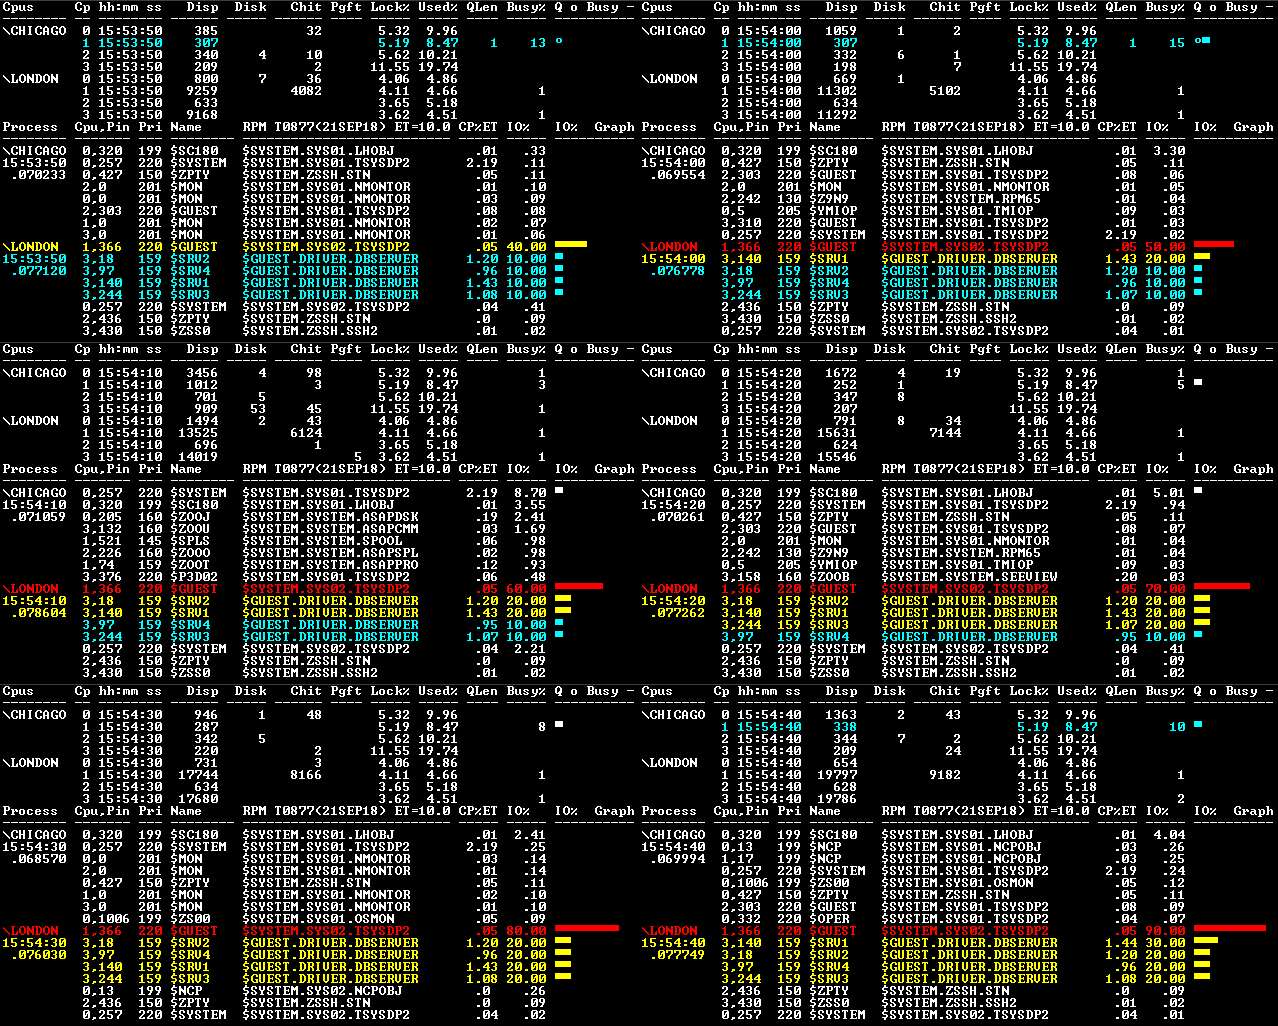

Figure 1 - ByBusy

The Figure 1 - ByBusy example shows how RPM update 2 has extended the notion of "busy" to provide a number of new ByItem selection criteria.  For example, the ByBusy option allows you to find the busiest processes in a whole network of servers in terms of those programs consuming the most processor cycles.  In release 2 there are a number of new by items which include: ByBusy, ByInputs, ByIOs, ByOutputs, ByMemory, ByPFS (process file segment), ByQ (receive queue), BySwaps (page faults), ...  with other new by items coming in the future.

Figure 1 shows the 3 busiest processes on node \NEWYORK in terms of Cpu usage. There are 3 processes consuming an extraordinary amount of Cpu resources on \NEWYORK.
1) Cpu 3 is 99.82% busy due to database query process $Q19.
2) Cpu 2 is 97.73% busy due to database query process $Q14.
3) Cpu 1 is 93.49% busy due to database query process $Q27.

While previous versions of RPM reported busiest processes in terms of Cpu busy, RPM update 2 now allows a wide-range of new by item selection options so that you can find busiest processes in a variety of new ways as shown in other examples on this page.

RPM Figure 1 - Process, ByBusy       - A     + A 
 

 Process  Cpu,Pin Busy% Name    RPM T0877 Programs 

 -------- ------- ----- ------- ---------------------
 \NEWYORK  3,73   99.82 $Q19    $DATA.APP.DBQUERY
 11:30:00  2,320  97.73 $Q14    $DATA.APP.DBQUERY
           1,263  93.49 $Q27    $DATA.APP.DBQUERY
           0,319   6.15 $QAZ07  $DATA2.APP.WEEKLY
           0,314    .12 $QAZ06  $DATA2.APP.DBSERVER
           0,175    .09 $ZOOH3  $DATA2.APP.DBSERVER
           1,0      .06 $MON    $SYSTEM.SYS03.OSIMAGE
           2,192    .04 $X11W   $DATA1.APP.MONTHLY
           0,43     .02 $QAZ05  $DATA1.APP.DBCLENT
           2,312    .02 $QAZ04  $DATA1.APP.DBSERVER


Figure 2 - ByInputs

RPM Figure 2 - Process, ByInputs
 

 Process  Cpu,Pin In%   Name    RPM T0877 Programs 

 -------- ------- ----- ------- ---------------------
 \LONDON   3,321  66.46 $DATA1  $SYSTEM.SYS03.TSYSDP2
 11:30:00  1,237  22.12 $SRV7   $DATA2.APP.DBSERVER
           2,405  22.11 $SRV5   $DATA2.APP.DBSERVER
           1,312  11.12 $SRV4   $DATA2.APP.DBSERVER
           0,315  11.11 $SRV1   $DATA2.APP.DBSERVER
           0,175    .09 $ZOOH3  $DATA2.APP.DBSERVER
           1,0      .06 $MON    $SYSTEM.SYS03.OSIMAGE
           2,192    .04 $X11W   $DATA1.APP.MONTHLY
           0,43     .02 $QAZ05  $DATA1.APP.DBCLENT
           2,312    .02 $QAZ04  $DATA1.APP.DBSERVER


The Figure 2 - ByInputs example shows the new RPM ByInputs option. This new by item allows you to find which processes are receiving the most input messages. Figure 2 shows the 5 busiest processes in terms of messages received on the node \LONDON.

New RPM real-time monitoring options allow you to discover the busiest processes many different ways. For example, by inputs, outputs, I/Os, etc, ... These options allow selective control over busiest process discovery in terms of the type of  busy attribute you wish to discover and analyze. 

In Figure 2 the busiest processes on node \LONDON  in terms of input messages received are:
1) 66.46 messages received per second for \LONDON  DISK  $DATA1
2) 22.12 messages received per second for \LONDON  server $SRV7
3) 22.11 messages received per second for \LONDON  server $SRV5
4) 11.12 messages received per second for \LONDON  server $SRV4
5) 11.11 messages received per second for \LONDON  server $SRV1


Figure 3 - ByMemory

The Figure 3 - ByMemory example shows the new RPM ByMemory option.  This new by item allows you to find which processes are consuming the most memory in real-time.  Figure 3 shows the top 8 memory consumers on \SANFRAN are using over 75% of available memory. Excessive memory usage by certain processes leads to swapping or page faults and causes poor performance as processes contend for memory space.  The top five memory consumers on \SANFRAN include:
1) 13.51% of processor memory is being used by disk process $SYSTEM.
2) 12.31% of processor memory is being used by disk process $DATA01.
3) 12.02% of processor memory is being used by disk process $DATA02.
4) 11.17% of processor memory is being used by disk process $DATA03.
5) 10.71% of processor memory is being used by disk process $DATA04.

Having a real-time picture of memory consumption by process is extremely important in terms of understanding networks of servers. RPM can discover memory usage from 1 to over 40,000,000 processes in real-time.

RPM Figure 3 - Process, ByMemory
 

 Process  Cpu,Pin MEM%  Name    RPM T0877 Programs 

 -------- ------- ----- ------- ---------------------
 \SANFRAN  2,73   13.51 $SYSTEM $SYSTEM.SYS02.TSYSDP2
 11:30:00  2,320  12.13
$DATA01 $SYSTEM.SYS02.TSYSDP2
           2,263  12.02 $DATA02 $SYSTEM.SYS03.TSYSDP2
           2,263  11.17 $DATA03 $SYSTEM.SYS03.TSYSDP2
           2
,314  10.71 $DATA04 $DATA2.APP.SORT
           2,175   7.53 $DATA05 $DATA2.APP.SORT
           2,0     5.06 $SPLS1  $SYSTEM.SYSTEM.SPOOLX
           2,192   4.04 $SPLS2  $SYSTEM.SYSTEM.SPOOLX
           3,43    0.97 $DATA08 $DATA1.APP.DBCLENT
           3,312   0.91 $QAZ04  $DATA1.APP.DBSERVER


Figure 4 - ByPFS

RPM Figure 4 - Process, ByPFS
 

 Process  Cpu,Pin PFS%  Name    RPM T0877 Programs 

 -------- ------- ----- ------- ---------------------
 \TOKYO    0,217  81.08 $Q17    $DATA.APP.DBQUERY
 11:30:00  2,320  12.73 $Q14    $DATA.APP.DBQUERY
           0,319   1.40 $ZNES   $SYSTEM.SYS00.SCP
           0,314   0.97 $ZNET   $SYSTEM.SYS00.SCP
           0,314    .12 $SRV12  $DATA2.APP.DBSERVER
           0,175    .09 $SRV19  $DATA2.APP.DBSERVER
           1,283    .06 $SRV27  $DATA2.APP.DBSERVER
           2,192    .04 $X11W   $DATA1.APP.DBSERVER
           1,143    .02 $QAZ05  $DATA1.APP.DBSERVER
           3,122    .02 $QAZ04  $DATA1.APP.DBSERVER
The Figure 4 - ByPFS example shows the new RPM ByPFS option. Monitoring PFS usage is important because application programs sometimes unknowingly "leak" file opens and consequently "leak" PFS memory. The RPM ByPFS option analyzes each processes consumption of Process File Segment (PFS) memory and displays processes that consume the most process file segment (PFS) space.  Different NonStop OS versions have different limits on the maximum size of their PFS segment.  RPM understands the rules behind these limits, and can analyze and report the percent% maximum consumption of each processes PFS segment.

Figure 4 shows how RPM found a process on node \TOKYO consuming 81.08% of its PFS.  On an S-series NonStop server a 1% PFS consumption corresponds to roughly 250 file opens. Thus a PFS consumption of 81% corresponds to roughly 20,000 file opens. This was found to be due to an excessive number of file opens. Thus this process was "leaking" file opens and was running out of PFS memory.  The following are the top 3 PFS consumers on node \TOKYO:
1) 81.01% process file segment consumption for process $Q17.
2) 12.73% process file segment consumption for process $Q14.
3)   1.40% process file segment consumption for process $ZNES.


Figure 5 - ByQ

The Figure 5 - ByQ or ByRcvQ example shows the new RPM receive queue option.  This by item allows you to find in real-time processes that have the longest receive queue.  A process receive queue represents the number of requests queued against a given process.

Figure 5 shows 3 processes with exceptionally long receive queues.  Processes with long request queues are processes that are behind in terms of processing the work queued against them.  The 3 processes with the longest receive queues are:
1) 77.46% receive queue against process $SRV9.
2) 63.12% receive queue against process $SRV7.
3) 51.23% receive queue against process $SRV5.

Having a real-time picture of the receive queue length forming against each process is extremely important in terms of understanding whether you network of servers is "keeping up" with the load. RPM can continuously discover the receive queue on each of 40,000,000 processes in real-time.

RPM Figure 5 - Process, ByRcvQ
 

 Process  Cpu,Pin RcvQ% Name    RPM T0877 Programs 

 -------- ------- ----- ------- ---------------------
 \LONDON   9,281  77.46 $SRV9   $DATA2.APP.DBSERVER
 11:30:00  1,237  63.12 $SRV7   $DATA2.APP.DBSERVER
           2,405  51.23 $SRV5   $DATA2.APP.DBSERVER
           3,112  19.37 $SRV3   $DATA2.APP.DBSERVER
           0,489  11.84 $SRV2   $DATA2.APP.DBSERVER
           2,961   8.09 $SRV4   $DATA2.APP.DBSERVER
           3,290   5.12 $SRV8   $DATA2.APP.DBSERVER
           0,506   0.87 $SRV6   $DATA2.APP.DBSERVER
           1,871   0.64 $SRV0   $DATA2.APP.DBSERVER
           0,315   0.50 $SRV1   $DATA2.APP.DBSERVER


Figure 6 - BySwaps

RPM Figure 6 - Process, BySwaps
 

 Process  Cpu,Pin Swap% Name    RPM T0877 Programs 

 -------- ------- ----- ------- ---------------------
 \LONDON   1,714  51.24 $Q31    $DATA2.APP.DBQUERY
 11:30:00  3,145  37.39 $Q22    $DATA2.APP.DBQUERY
           2,918  11.40 $SRV11  $DATA2.APP.DBSERVER
           0,413   2.97 $SRV09  $DATA2.APP.DBSERVER
           0,411    .17 $SRV12  $DATA2.APP.DBSERVER
           1,409    .05 $SRV19  $DATA2.APP.DBSERVER
           1,231    .04 $SRV27  $DATA2.APP.DBSERVER
           0,127    .04 $X11W   $DATA1.APP.DBSERVER
           2,134    .02 $QAZ05  $DATA1.APP.DBSERVER
           3,122    .01 $QAZ04  $DATA1.APP.DBSERVER
The Figure 6 - BySwaps example shows the new RPM BySwaps option. This by item allows you to see in real-time which processes have excessive memory page faults (swaps).  Finding processes that have page faults is critical since processes that are page faulting are slowed down waiting for the memory manager to "page-in" memory pages they need to run. Thus any process that is continuously page faulting has a serious performance problem.

Figure 6 shows that RPM has found processes on node \LONDON  that have excessive page faults (swaps).  The following are the top 3 processes page faulting on node \LONDON :
1) 51.24 page faults per second are occurring for process $Q31.
2) 37.39 page faults per second are occurring for process $Q22.
3) 11.40 page faults per second are occurring for process $SRV11.


Click here, for more Examples